Scott's Blog

学则不固, 知则不惑

0%

Python 神经网络分析基础

今天我们学习神经网络与nexworkX.

网络基础

什么是神经网络呢?我们可以想象它是我们的社交网络,或者是我们的高铁运输网络,神经网络对于模拟 实体之间的关系 非常有用,通过这种模拟,你可以了解到,在整个网络中,哪一个实体(或者说节点node)是比较重要的,各个实体之间的联系,实体之间的距离怎么走最短。

对于网络 graph,是由节点与关系组成的,节点叫做 node,关系叫做 edge.

网络中的nodeedge都可以有自己的属性。来看下面这张社交关系的图:

图中Hugo和Eric是朋友,他们各自都有各自的属性

  • id
  • age

他们是朋友,所以关系edge即 Friendship,关系也有属性,标注了他们第一次成为朋友的时间。

NetworkX基础

在python中,我们如何表示网络与网络节点之间的关系呢?在python中,我们使用networkX这个包。下面建立一个网络的基本代码:

1
2
import networkx as nx
G = nx.Graph()

G即为一个网络,可以通过 ‌G.add_nodes_from([1, 2, 3])往其中添加节点,节点添加进去以后,就可以使用G.nodes()来查看节点,此处会返回这个网络的所有节点。

那关系又要怎么定义呢?我们可以直接使用G.add_edge(1, 2) 方法将两个实体连接起来,这会在节点1与2之间创建关系。

前面提到了,我们的节点可以有属性,给节点的属性赋值很简单,直接赋值即可:G.node[1]['label'] = 'blue'.

如果你想知道网络的节点有哪些属性,通过G.nodes(data=True)即可查看:

1
Out: [(1, {'label': 'blue'}), (2, {}), (3, {})]

图的类型

图的类型简单就是说节点之间的关系,举例来说,Facebook是undirected graphs,当一个人与另一个人成为朋友之后,这两个人自动就连接到了一起,在这种关系中,两个节点知识连接到了一起,没有方向性。undirected graphs类型的图在networkx中的类型就是graph,当你用type命令检测它的类型时,会显示networkx.classes.graph.Graph.

另外第一种是Directed grarphs,这种图里的节点就好像twitter中的用户之间的关系,比如一个用户也许关注了一个人,但是另外一个人可能却没有关注它,这时候两者的关系就是单向的关系,这两个node之间的关系我们会用一个箭头表示,这种类型的图在networkx中用networkx.classes.graph.Digraph表示。

两个节点之间的关系也会有多条edge存在的情况,比如两个站点之间所有的路线,这种图叫做MutilDIGraph。

对于两个两个节点之间,如果存在多个edge,这会导致计算量变得很大,这时候我们会将它们之间edge的管家信息保存成edge的属性,方便计算,比如将3条edge合并成1条,同时指定这条edge的metadata为3.

需要注意,在我们的车站的例子中,还有一种情况是我们的起点与终点是同一个站,这种特殊的情况叫做self-loops.

绘制图

我们使用 nxviz 这个包来绘制接下来介绍的三种图,Matrix、arc和Circos图,强烈推荐你安装,你可以通过pip pip install nxviz 或者conda命令conda install -c conda-forge nxviz安装,更多关于nxviz的资料.

Matrix plots

Matrix plots图是一种用矩阵方格来表示节点之间关系的图,左边是Matrix图,右边是我们的节点关系。

  • A-A是白的,表示它与它自己没有联系
  • A-B是黑色的,表示A指向B之间存在联系
  • B-A是白色的,表示B指向A无联系

每个节点都对应一列与一行,两个节点之间的边由值1表示。但是,这样做仅保留了weight元数据(edge上的属性);

下面是使用nxviz绘制graph对象T的例子:

1
2
3
4
5
6
7
8
9
10
11
12
13
14
15
16
17
18
19
20
21
# Import nxviz
import nxviz as nv

# Create the MatrixPlot object: m
m = nv.MatrixPlot(T)

# Draw m to the screen
m.draw()

# Display the plot
plt.show()

# Convert T to a matrix format: A
A = nx.to_numpy_matrix(T)

# Convert A back to the NetworkX form as a directed graph: T_conv
T_conv = nx.from_numpy_matrix(A, create_using=nx.DiGraph())

# Check that the `category` metadata field is lost from each node
for n, d in T_conv.nodes(data=True):
assert 'category' not in d.keys()

图像如下:

Matrix plots with nxviz

Circos plots

Circos plots是一种围绕着圆心绘制的图,看起来非常美观。

绘制上图的代码如下:

1
2
3
4
5
6
7
8
9
10
11
12
# Import necessary modules
import matplotlib.pyplot as plt
from nxviz import CircosPlot

# Create the CircosPlot object: c
c = CircosPlot(T)

# Draw c to the screen
c.draw()

# Display the plot
plt.show()

Arc plots

Arc plots即弧形图,它就好像把Circos plots展开成一条线,正因如此它需要我们指定排序。

代码:

1
2
3
4
5
6
7
8
9
10
11
12
13
14
15
16
17
18
19
20
21
# Import necessary modules
import matplotlib.pyplot as plt
from nxviz import ArcPlot

# Create the un-customized ArcPlot object: a
a = ArcPlot(T)

# Draw a to the screen
a.draw()

# Display the plot
plt.show()

# Create the customized ArcPlot object: a2
a2 = ArcPlot(T,node_order='category',node_color='category')

# Draw a2 to the screen
a2.draw()

# Display the plot
plt.show()

node_order='keyX'node_color='keyX' 即指定这个图的排序方式与颜色区分参考选项。

重要的节点

如果我们需要分析图,我们就需要对图的节点有所了解,对于一张图来说,其中有重要的节点,也有不那么重要的节点,比如对于地铁来说,那些市中心的换乘站比其他线路的终点站要重要,接下来我们介绍几个与节点有关的概念。

Degree Centrality

Degree即一个node拥有多少个邻居,Degree Centrality即根据图中节点邻居的个数来给每个节点打分,如果一个节点连接的邻居更多,那它就更重要,分数也更高,Degree Centrality的定义为:

\[\frac{Neighbors\ I\ Have}{Neighbors\ I\ Could\ Possible\ Have}\]

这里的 Neighbors I could possible have 就是所有的节点,如果我们的讨论氛围允许self-loops存在,则它也包括我们自己,如果不允许,则只算所有除我之外的节点。

在networkx中,你可以使用 G.neighbors(node_name) 来查看一个节点拥有多少个邻居,如果你传进一个没有的节点,networkx则会抛出一个错误。

当我们有了所有节点的邻居数,就可以根据它来计算每个节点在图中的重要性,你可以使用 nx.degree_centrality(G) 来查看所有节点的Degree Centrality分数,注意这里分数的计算中,不包含self-loops的情况。

我们定义一个函数,它会找到我们网络中邻居数最高的节点,有了它我们就可以很方便的处理一些问题,如找到Twitter用户中,那些最有影响力的用户:

1
2
3
4
5
6
7
8
9
10
11
12
13
14
15
16
17
18
19
20
21
22
23
24
25
26
27
28
29
# Define find_nodes_with_highest_deg_cent()
def find_nodes_with_highest_deg_cent(G):

# Compute the degree centrality of G: deg_cent
deg_cent = nx.degree_centrality(G)

# Compute the maximum degree centrality: max_dc
max_dc = max(list(deg_cent.values()))

nodes = set()

# Iterate over the degree centrality dictionary
for k, v in deg_cent.items():

# Check if the current value has the maximum degree centrality
if v == max_dc:

# Add the current node to the set of nodes
nodes.add(k)

return nodes

# Find the node(s) that has the highest degree centrality in T: top_dc
top_dc = find_nodes_with_highest_deg_cent(T)
print(top_dc)

# Write the assertion statement
for node in top_dc:
assert nx.degree_centrality(T)[node] == max(nx.degree_centrality(T).values())

Path finding

path finding有很多的应用范围,比如两个车站之间最短路线的寻找,消息、病毒的传播,我们知道两个节点之间有很多种路线可以选择,那么要如何找到最短的这条路线呢?

一种解决方案是,使用Bread-first search算法,它的原理如下图:

我们从黄色的节点开始,第一次找黄色节点的邻居,并检查目标节点是否在当前节点的邻居中,如果不存在就继续搜寻下一层节点,找到为止。

我们首先定一个寻找节点之间路径的算法:

1
2
3
4
5
6
7
8
9
10
11
12
13
14
15
16
17
18
19
20
21
22
# Define path_exists()
def path_exists(G, node1, node2):
"""
This function checks whether a path exists between two nodes (node1, node2) in graph G.
"""
visited_nodes = set()

# Initialize the queue of nodes to visit with the first node: queue
queue = [node1]

# Iterate over the nodes in the queue
for node in queue:

# Get neighbors of the node
neighbors = G.neighbors(node)

# Check to see if the destination node is in the set of neighbors
if node2 in neighbors:
print('Path exists between nodes {0} and {1}'.format(node1, node2))
return True
break

这个算法会确定两个节点之间是否存在路径,仔细查看上面的代码,如果两个节点直接存在路径,该函数就返回true,如果不存在呢?不存在我们则需要对剩下的节点进一步的搜寻,让我们把剩下的代码补全:

1
2
3
4
5
6
7
8
9
10
11
12
13
14
15
16
17
18
19
def path_exists(G, node1, node2):
"""
This function checks whether a path exists between two nodes (node1, node2) in graph G.
"""
visited_nodes = set()
queue = [node1]

for node in queue:
neighbors = G.neighbors(node)
if node2 in neighbors:
print('Path exists between nodes {0} and {1}'.format(node1, node2))
return True

else:
# Add current node to visited nodes
visited_nodes.add(node)

# Add neighbors of current node that have not yet been visited
queue.extend([n for n in neighbors if n not in visited_nodes])

如果函数中的queue已经空了,也就是找完了了都没找到路径,那我们也要返回结果:即这两个节点之间没有路径存在:

1
2
3
4
5
6
7
8
9
10
11
12
13
14
15
16
17
18
19
20
21
22
23
24
def path_exists(G, node1, node2):
"""
This function checks whether a path exists between two nodes (node1, node2) in graph G.
"""
visited_nodes = set()
queue = [node1]

for node in queue:
neighbors = G.neighbors(node)
if node2 in neighbors:
print('Path exists between nodes {0} and {1}'.format(node1, node2))
return True
break

else:
visited_nodes.add(node)
queue.extend([n for n in neighbors if n not in visited_nodes])

# Check to see if the final element of the queue has been reached
if node == queue[-1]:
print('Path does not exist between nodes {0} and {1}'.format(node1, node2))

# Place the appropriate return statement
return False

Betweenness centrality

Betweenness centrality这个概念与最短路径息息相关,上面我们已经定义了如何找到最短路径的算法,那么对于我们图中所有的节点对(两个节点),都有它们的最短路径,这些最短路径通过的节点中,哪些节点的通过数是最高的,则它的重要性就更高,这就是Betweenness centrality的意思,它的定义为:

\[\frac{num.\ shortest\ paths\ through\ node}{all\ possible\ shortest\ paths}\]

Betweenness centrality对于找到两个群体之间联系必须通过的那些实体很有帮助,比如那些帮助两个党派之间的联系的,充当桥梁作用的人,互联网中两个地区之间的网络流量交流,确定那些很重要的节点。

Betweenness centrality可以直接通过nx的方法计算得到:

1
bet_cen = nx.betweenness_centrality(T)

Communities & cliques

cliques即我们所说的小团体、小集团,事实上这个说法就来源于我们的社交生活,在我们所说的小团体中,我们认识其他所有人,而cliques也是这样,每个一个节点都与其他的节点都有连接。

举例,一个最简单的cliques就是一个三角形,在Facebook的社交网络中,如果a认识b,b认识c,如果c也认识a,那么这就是一个三角形,但是如果不认识,我们就可以推荐他们认识,如何找到这些缺了一条联系就可以组成三角形的关系呢?

我们定义一个函数,它接受两个参数,G:一个网络,n一个节点,这个函数会确定n节点在G网络中,是否存在三角关系,即: node n in graph G is in a triangle relationship or not.

在我们的算法中,我们根据传入的网络,找到n的所有邻居,然后遍历其所有邻居对,如果其中有某一对存在edge关系,那么这就组成了一个三角关系(因为这两者已经是n的邻居,而这两者之间又有关系)

算法如下:

1
2
3
4
5
6
7
8
9
10
11
12
13
14
15
16
17
18
19
from itertools import combinations

# Define is_in_triangle()
def is_in_triangle(G, n):
"""
Checks whether a node `n` in graph `G` is in a triangle relationship or not.

Returns a boolean.
"""
in_triangle = False

# Iterate over all possible triangle relationship combinations
for n1, n2 in combinations(G.neighbors(n),2):

# Check if an edge exists between n1 and n2
if G.has_edge(n1,n2):
in_triangle = True
break
return in_triangle

combinations是一个遍历工具,用于组合节点的所有邻居对。

我们修改一下,找出所有的三角关系:

1
2
3
4
5
6
7
8
9
10
11
12
13
14
15
16
17
18
19
20
21
22
23
24
25
from itertools import combinations

# Write a function that identifies all nodes in a triangle relationship with a given node.
def nodes_in_triangle(G, n):
"""
Returns the nodes in a graph `G` that are involved in a triangle relationship with the node `n`.
"""
triangle_nodes = set([n])

# Iterate over all possible triangle relationship combinations
for n1, n2 in combinations(G.neighbors(n),2):

# Check if n1 and n2 have an edge between them
if G.has_edge(n1,n2):

# Add n1 to triangle_nodes
triangle_nodes.add(n1)

# Add n2 to triangle_nodes
triangle_nodes.add(n2)

return triangle_nodes

# Write the assertion statement
assert len(nodes_in_triangle(T, 1)) == 35

如果你想要做一个好友推荐系统,那么你可能需要找出那些open triangle关系,即我们刚才提到的,a认识b,b认识c,而a并不认识c,让我们写一个找这种open triangle关系的函数:

1
2
3
4
5
6
7
8
9
10
11
12
13
14
15
16
17
18
19
20
from itertools import combinations

# Define node_in_open_triangle()
def node_in_open_triangle(G, n):
"""
Checks whether pairs of neighbors of node `n` in graph `G` are in an 'open triangle' relationship with node `n`.
"""
in_open_triangle = False

# Iterate over all possible triangle relationship combinations
for n1, n2 in combinations(G.neighbors(n),2):

# Check if n1 and n2 do NOT have an edge between them
if not G.has_edge(n1,n2):

in_open_triangle = True

break

return True

我们可以利用这个函数来查看一个图中,有多少个open triangle:

1
2
3
4
5
6
7
8
9
10
11
12
13
# Compute the number of open triangles in T
num_open_triangles = 0

# Iterate over all the nodes in T
for n in T.nodes():

# Check if the current node is in an open triangle
if node_in_open_triangle(T,n):

# Increment num_open_triangles
num_open_triangles += 1

print(num_open_triangles)

Maximal cliques

我们已经有了cliques的概念,maximal cliques的意思是,在一个团体中,我们增加一个node,如果整个图像中的节点还是彼此互相连接着的,那么这个cliques还是一个cliques,但如果我们增加node后,整个图像的节点不再是彼此连接着,那增加前的图像就是我们的maximal cliques.

nexworkx提供了一个find_cliques方法来寻找所有的cliques与Maximal cliques。

下面是对find_cliques方法的一个实践,我们定义了一个函数用来寻找一个图中拥有size数的max_cliques的个数。

1
2
3
4
5
6
7
8
9
10
11
12
13
# Define maximal_cliques()
def maximal_cliques(G, size):
"""
Finds all maximal cliques in graph `G` that are of size `size`.
"""
mcs = []
for clique in nx.find_cliques(G):
if len(clique) == size:
mcs.append(clique)
return mcs

# Check that there are 33 maximal cliques of size 3 in the graph T
assert len(maximal_cliques(T, 3)) == 33

Subgraphs

Subgraphs即子图的意思,对于一个图,我们需要对一些感兴趣的信息突出展示,这时候就需要用到子图。

下面是绘制子图的一个例子:

1
2
3
4
5
6
7
8
9
10
11
12
13
14
# 导入包
In [1]: import networkx as nx
# 创建图
In [2]: G = nx.erdos_renyi_graph(n=20, p=0.2)
# 查看节点
In [3]: G.nodes()
Out[3]: [0, 1, 2, 3, 4, 5, 6, 7, 8, 9, 10, 11, 12, 13, 14, 15, 16,
17, 18, 19]

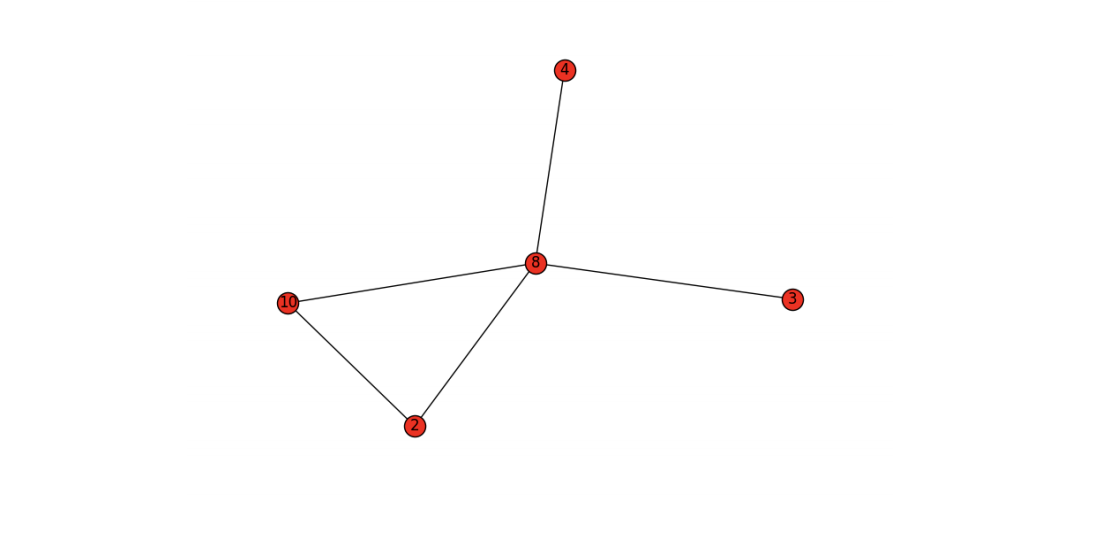
# 将上面图中的节点8复制给nodes
In [4]: nodes = G.neighbors(8)
In [5]: nodes
Out[5]: [2, 3, 4, 10]
In [6]: nodes.append(8)
1
2
3
4
5
6
7
8
9
10
# 将子图添加到G
In [7]: G_eight = G.subgraph(nodes)

# 查看G_eight的edges
In [8]: G_eight.edges()
Out[8]: [(8, 2), (8, 3), (8, 4), (8, 10), (2, 10)]
In [9]: G_eight
Out[9]: <networkx.classes.graph.Graph at 0x10cae39e8>
In [10]: G
Out[10]: <networkx.classes.graph.Graph at 0x10cad1f60>

效果:

因为绘制子图的操作经常要用到,我们可以写一个函数来简化这个步骤,这个函数接受一个图与节点数组(即感兴趣的节点):

1
2
3
4
5
6
7
8
9
10
11
12
13
14
15
16
17
18
19
20
# Define get_nodes_and_nbrs()
def get_nodes_and_nbrs(G, nodes_of_interest):
"""
Returns a subgraph of the graph `G` with only the `nodes_of_interest` and their neighbors.
"""
nodes_to_draw = []

# Iterate over the nodes of interest
for n in nodes_of_interest:

# Append the nodes of interest to nodes_to_draw
nodes_to_draw.append(n)

# Iterate over all the neighbors of node n
for nbr in G.neighbors(n):

# Append the neighbors of n to nodes_to_draw
nodes_to_draw.append(nbr)

return G.subgraph(nodes_to_draw)

测试一下:

1
2
3
4
5
6
7
8
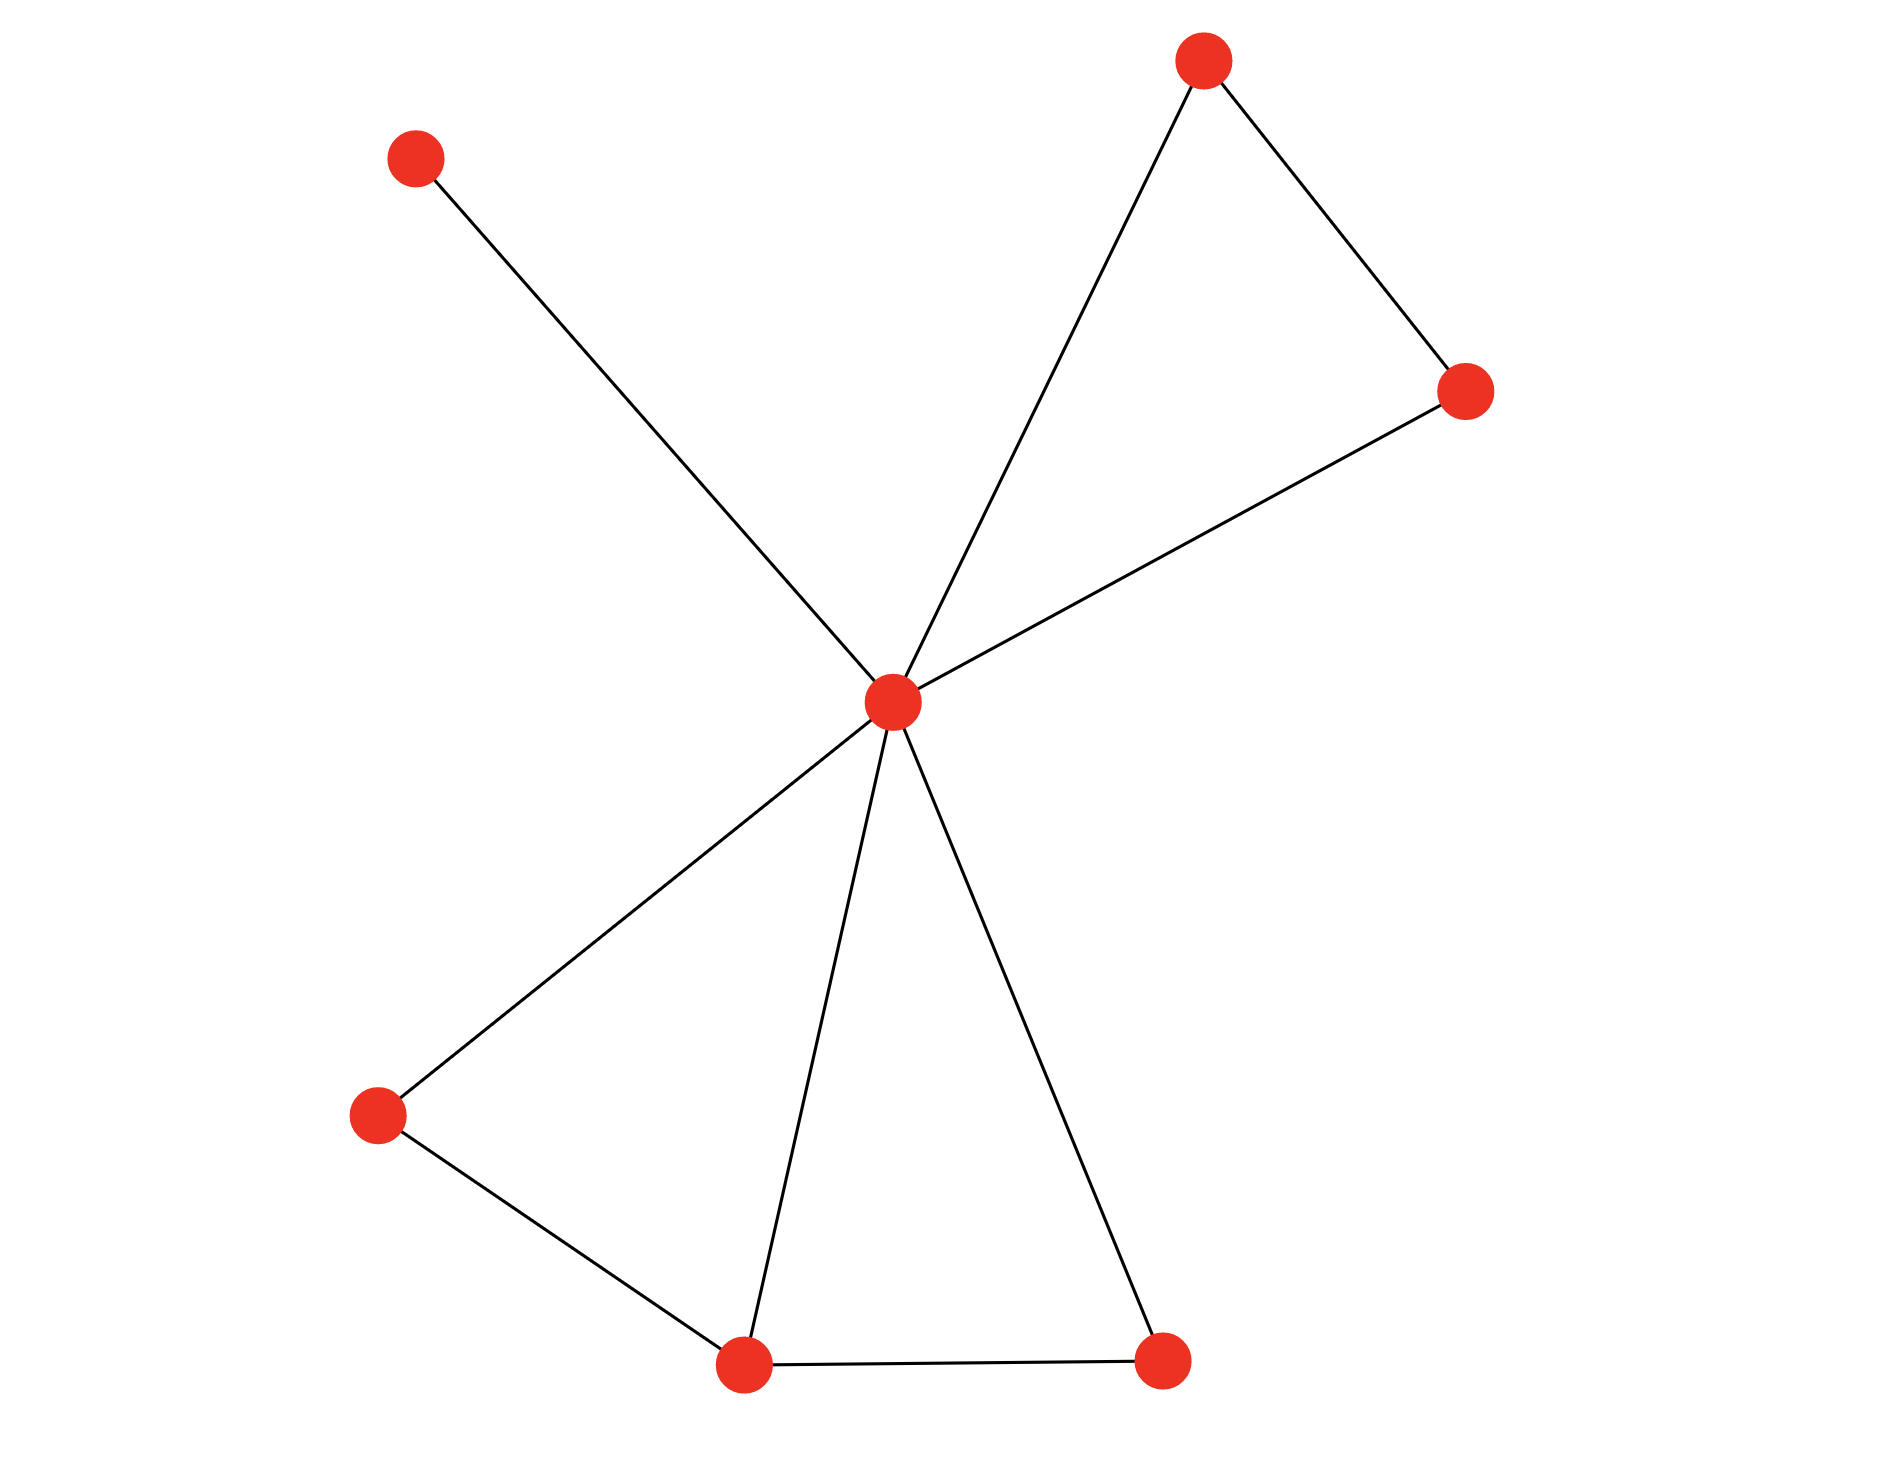
nodes_of_interest = [29, 38, 42]

# Extract the subgraph with the nodes of interest: T_draw
T_draw = get_nodes_and_nbrs(T,nodes_of_interest)

# Draw the subgraph to the screen
nx.draw(T_draw)
plt.show()